September 8th, 2020

Millions of companies of all sizes use Stripe’s software to accept payments, send payouts, and manage their businesses online. Now Power My Analytics users can integrate Stripe report, balance, transaction, and payment data into Google Data Studio’s reporting tools to quickly build interactive reports and dashboards. Connect your Stripe account using your Power My Analytics hub, then turn your data into compelling stories and see Stripe metrics next to eBay, Shopify, Walmart, Google Ads, and other merchant/marketing related sources.
We appreciate the feedback from those who participated during the Stripe beta period. We now offer a helpful report template that demonstrates the metrics and dimensions available. Whether you use it as a reference, starting template, or a quick way to cut and paste Stripe metrics into your existing reports, we highly recommend checking the “use report template” option when you create your first dashboard.
More info | Sample report | Data Studio
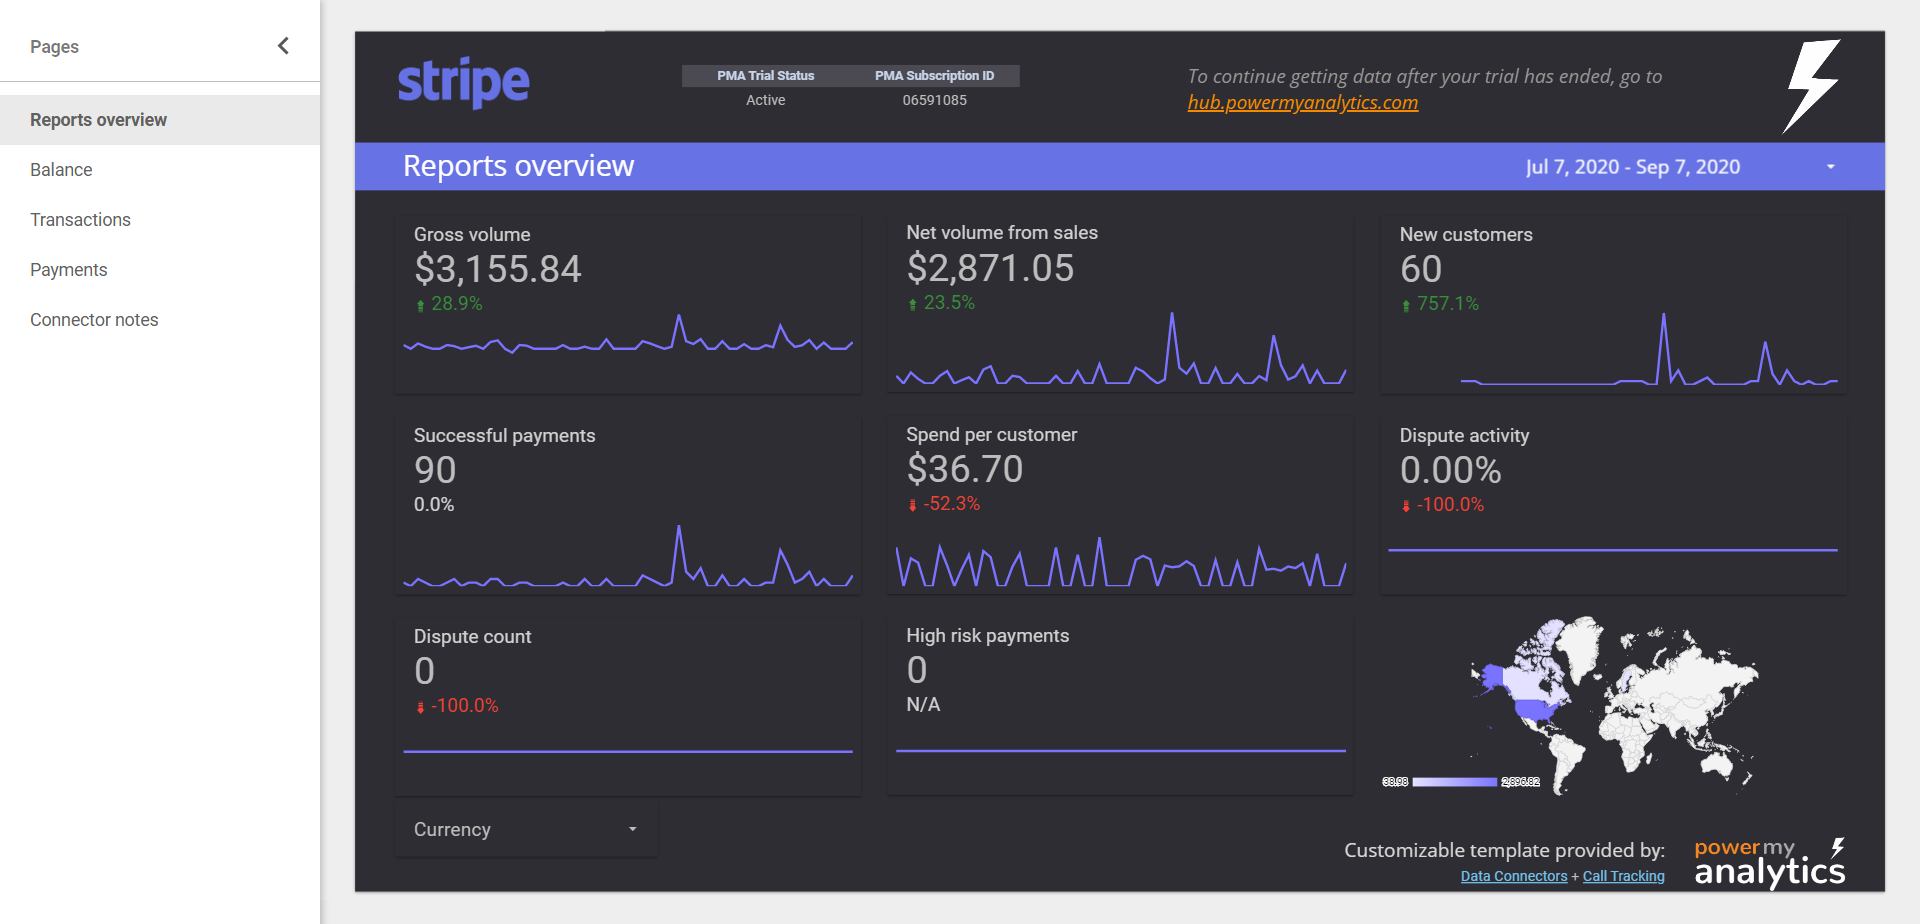
The same graphs from your Stripe dashboard can be automatically integrated into your Data Studio reports so that you don’t have to log in to Stripe to see them.
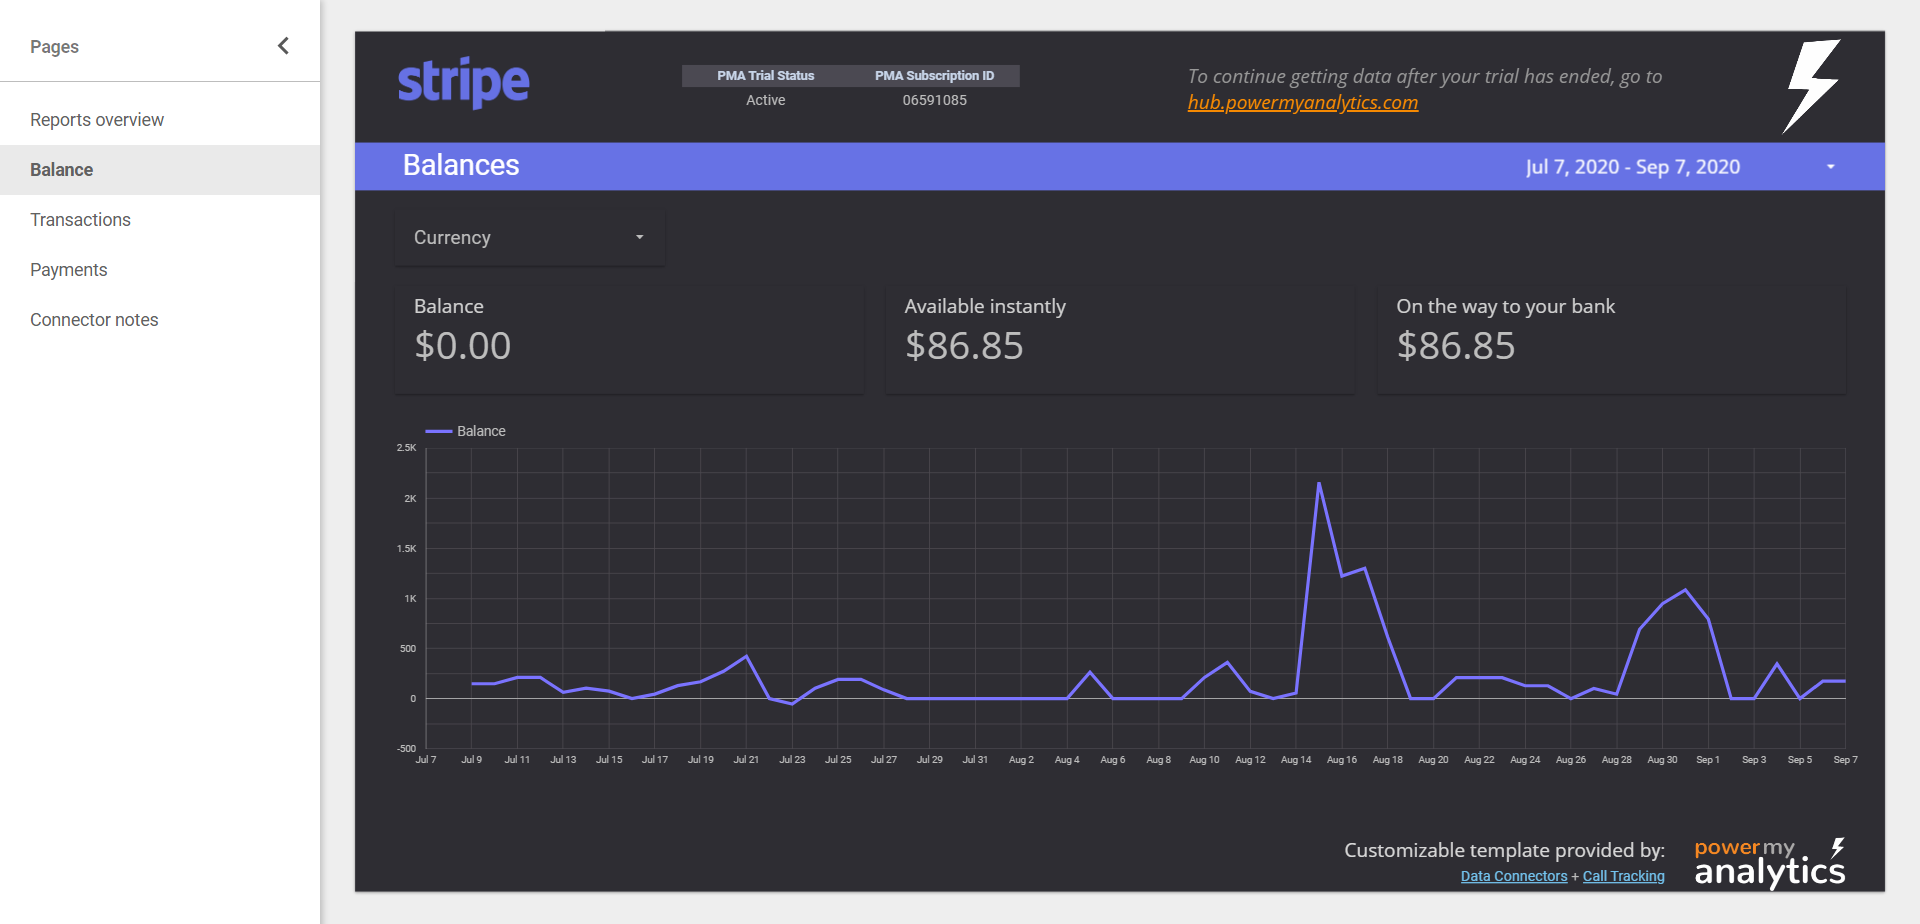
See your current balance, along with the amount of funds available instantly, and the amount on the way to your bank.
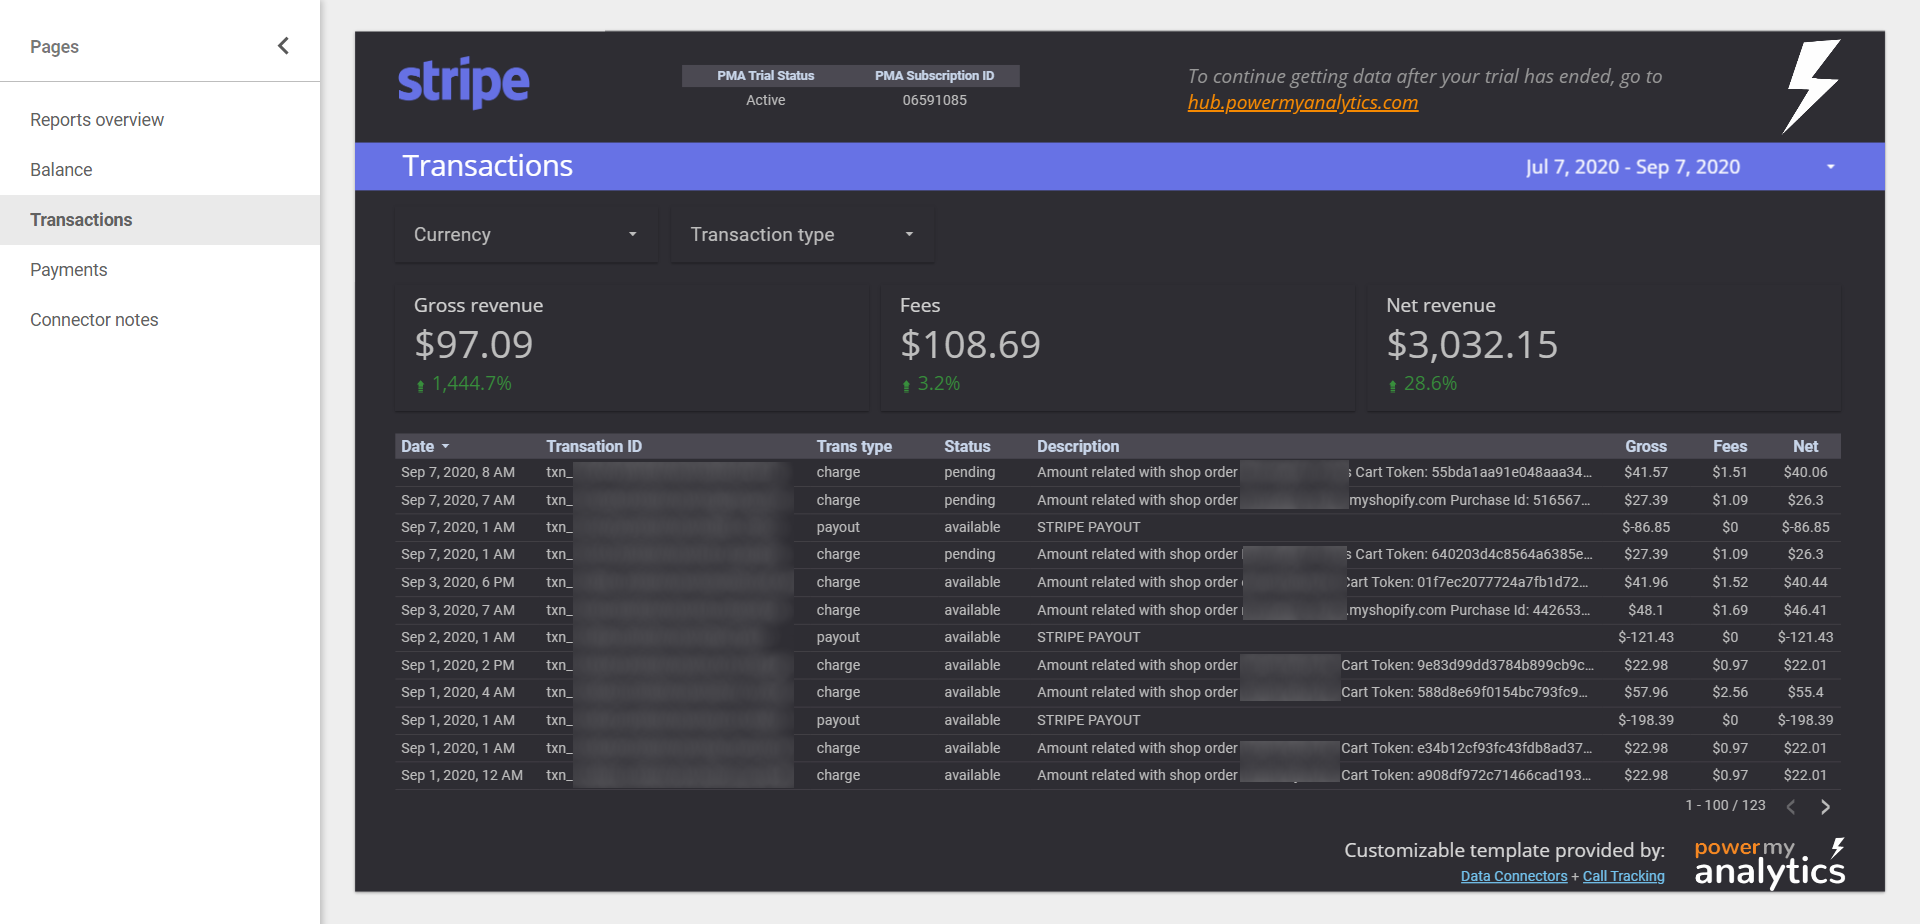
Display a list of transactions during a specified time period as well as overall revenue and fees. You can filter by both currency and transaction type.
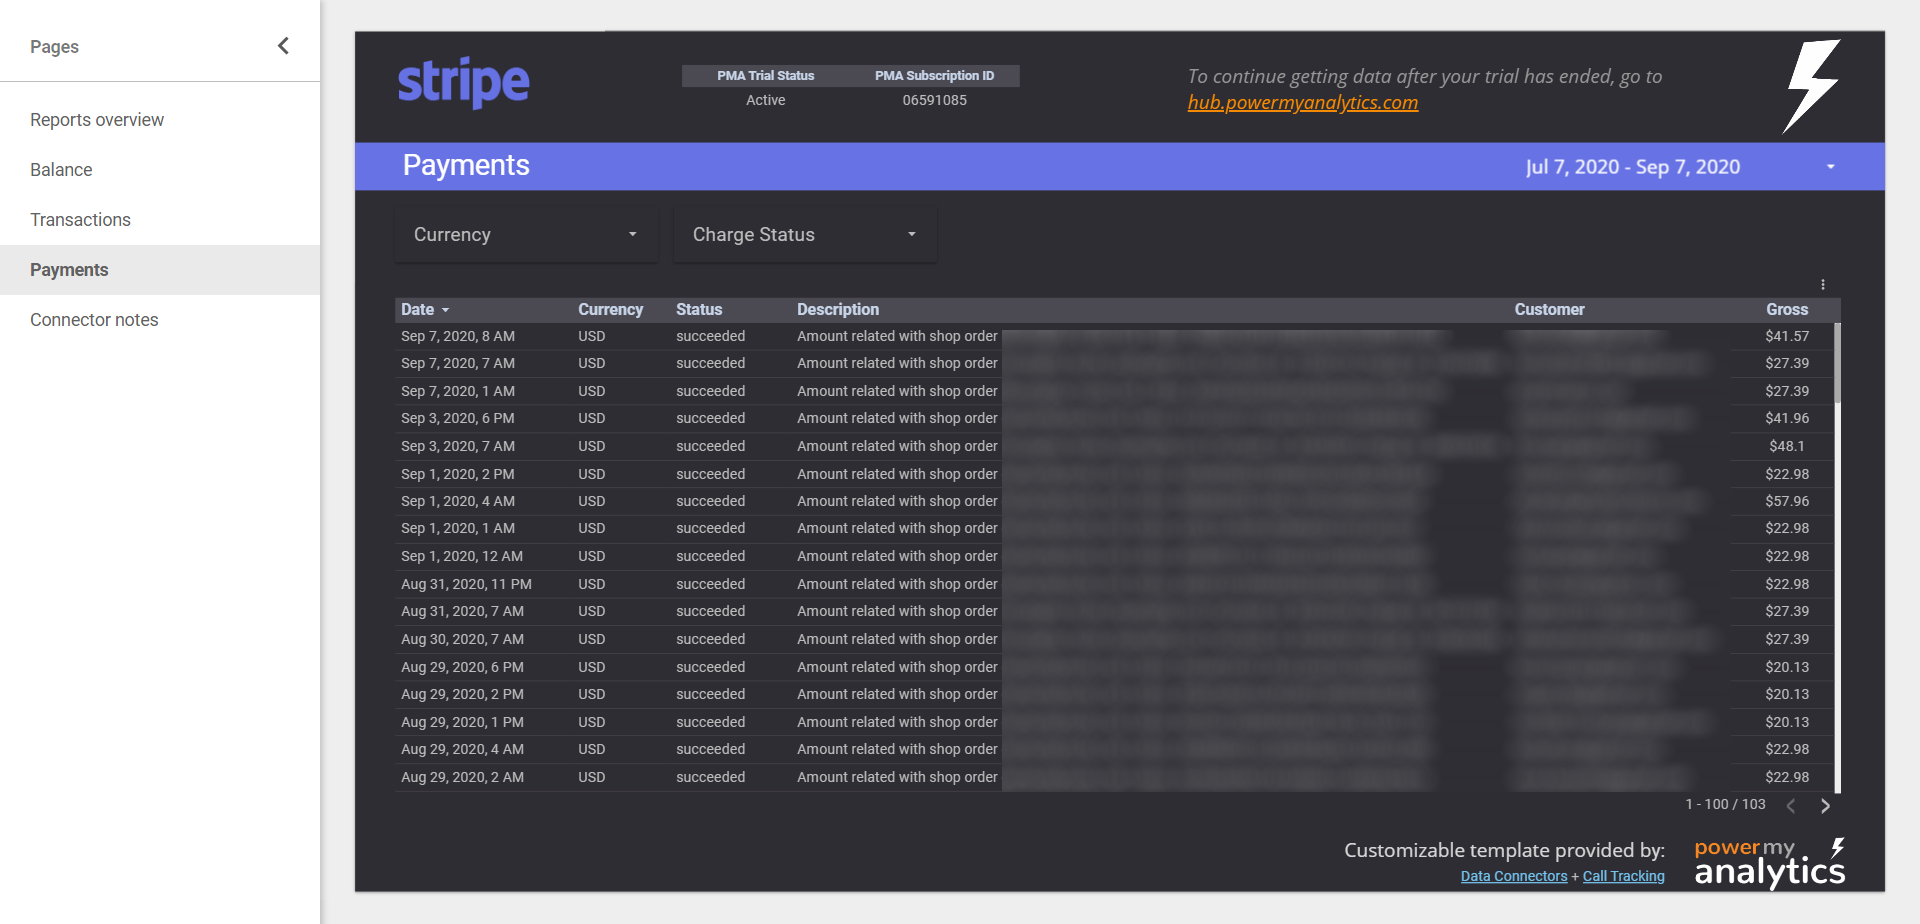
Display a list of payments by time period with the ability to filter by currency and charge status.
Preferred by data-driven businesses


